0%

Go性能分析工具pprof试用

pprof用法以及各项参数含义

1. 介绍

pprof 是一个用于可视化和分析性能剖析数据的工具。它读取 profile.proto 格式的采样数据(通常是函数调用栈),生成文本报告或图形(如调用图、火焰图)

它支持从本地文件或HTTP 服务读取数据。如果有二进制文件或源代码,还能把机器地址转换成函数名。

Go 官方深度集成了pprof,但是它本身不是 Go 内置命令,而是由 Google 开发的独立工具。

上面这个介绍是直接翻译的 源代码仓库 的README,但是在我自己的测试中,go tool已经内置了pprof,版本为1.25.1。

2. 使用

—–ENV: Ubuntu 22.04, go1.25.1, VS Code—–

写一个测试用例:

1
2
3
4
5
6
7
8
9
10
11
12
13
14
15
16
17
18
19
20
21
22
23
24
25
26
27
28
29
30
31
32
33
import (
"fmt"
"log"
"net/http"
_ "net/http/pprof"
"time"
)

// 模拟一个CPU密集型函数
func busyWork(n int) int {
sum := 0
for i := 0; i < n*1000000; i++ {
sum += i % 17
}
return sum
}

// 模拟一个内存分配函数
func allocMem(n int) []int {
return make([]int, n*1000)
}

func main() {
go func() {
for {
busyWork(100) // 消耗CPU
allocMem(1000) // 分配内存
time.Sleep(10 * time.Millisecond)
}
}()
// 下面这一行代码可以通过6060端口来查看pprof的输出
log.Println(http.ListenAndServe(":6060", nil))
}

然后执行

1
$ go run 01go_pprof_http.go 

我们使用pprof对这个结果进行一些分析

2.1 web查看

我们通过log.Println(http.ListenAndServe(":6060", nil))这一行代码指定了目录,它开启了一个web服务,通过ip:6060/debug/pprof/可以访问该分析结果。在我的开发环境下,访问 http://192.168.81.100:6060/debug/pprof/ 即可。

得到以下结果:

1
2
3
4
5
6
7
8
9
10
11
12
13
14
15
16
17
18
19
20
21
22
23
24
25
26
27
28
29
/debug/pprof/
Set debug=1 as a query parameter to export in legacy text format


Types of profiles available:
Count Profile
6 allocs
0 block
0 cmdline
5 goroutine
6 heap
0 mutex
0 profile
0 symbol
11 threadcreate
0 trace
full goroutine stack dump
Profile Descriptions:

allocs: A sampling of all past memory allocations
block: Stack traces that led to blocking on synchronization primitives
cmdline: The command line invocation of the current program
goroutine: Stack traces of all current goroutines. Use debug=2 as a query parameter to export in the same format as an unrecovered panic.
heap: A sampling of memory allocations of live objects. You can specify the gc GET parameter to run GC before taking the heap sample.
mutex: Stack traces of holders of contended mutexes
profile: CPU profile. You can specify the duration in the seconds GET parameter. After you get the profile file, use the go tool pprof command to investigate the profile.
symbol: Maps given program counters to function names. Counters can be specified in a GET raw query or POST body, multiple counters are separated by '+'.
threadcreate: Stack traces that led to the creation of new OS threads
trace: A trace of execution of the current program. You can specify the duration in the seconds GET parameter. After you get the trace file, use the go tool trace command to investigate the trace.

在中间部分

1
2
3
4
5
6
7
8
9
10
11
12
13
Types of profiles available:
Count Profile
6 allocs
0 block
0 cmdline
5 goroutine
6 heap
0 mutex
0 profile
0 symbol
11 threadcreate
0 trace
full goroutine stack dump

即为pprof可以分析的性能数据,前面的数字表示当前采样到的数量,这个数字是会实时变动的。

在这个网页下方,还附上了每一种分析维度的解释,这里列出人力翻译:

1
2
3
4
5
6
7
8
9
10
11
12
13
14
15
16
17
18
19
20
21
22
23
allocs: 对程序运行以来所有内存分配行为的采样

block: 因同步原语阻塞而等待的 goroutine 调用栈。
hxy注:这个profiling在文档中提到默认是不开启的,但是我开关这个功能,似乎毫无变化,它好像已经默认开启了,需要后续进一步测试。

cmdline: 当前程序启动时的完整命令行

goroutine: 当前所有 goroutine 的调用栈。加上 ?debug=2 参数,会以panic的格式输出
hxy注:这里的debug=1会输出一种紧凑的goroutine调用栈格式,这个主要是给pprof分析使用的,而debug=2的输出为panic格式,和日常看到的panic相同,方便人力定位错误。

heap: 对当前存活对象的采样。可通过 ?gc=1 参数在采样前先强制GC

mutex: 互斥锁的持有者调用栈
hxy注:这个和前面的block一样,在文档中提到默认是不开启的,也同样没发现开关之后的区别在哪,后面再测试。

profile: CPU 性能剖析。可通过 ?seconds=N 这个参数指定采样时长,获得profile文件之后可以通过go pprof命令对文件进行解析。

symbol: 将内存地址转换为函数名。
hxy注:这个功能看起来不起眼但根据我有限的经验来说是一个超强功能,比如可以对应到源码行号。

threadcreate: 导致创建新线程的调用栈

trace: 程序执行的详细追踪记录。可通过 ?seconds=N 指定时长,用 go tool trace 分析结果。

2.2 脚本访问

可以通过上一个小节的web网页中看到,有一些分析的数据是需要某个时间切片内的采样的,比如profile、trace等,这些数据可以通过脚本进行访问,这意味着有很多数据可以拿到之后自己进行分析,有点geek的DIY那味了。

下面通过脚本来获取profile数据

1
2
3
hxy@ubu22:~
$ go tool pprof http://127.0.0.1:6060/debug/pprof/profile
Fetching profile over HTTP from http://127.0.0.1:6060/debug/pprof/profile

在输入该命令后,它会fetching 30秒,可以通过-SECONDS=40修改为40秒,然后会有以下输出:

1
2
3
4
5
6
7
8
9
10
$ go tool pprof http://127.0.0.1:6060/debug/pprof/profile
Fetching profile over HTTP from http://127.0.0.1:6060/debug/pprof/profile
Saved profile in /home/hxy/pprof/pprof.01go_pprof_http.samples.cpu.001.pb.gz
File: 01go_pprof_http
Build ID: 73279fc58b5957f1b741009f367707697095f6e5
Type: cpu
Time: 2025-09-25 16:17:50 CST
Duration: 30.13s, Total samples = 21.46s (71.23%)
Entering interactive mode (type "help" for commands, "o" for options)
(pprof)

这个是一个交互式界面,可以输入help来查看有哪些数据可以查看。

1
2
3
4
5
6
7
8
9
10
11
12
13
14
15
16
17
18
19
20
21
22
23
24
25
26
27
28
29
30
31
32
33
34
35
36
37
38
39
40
41
42
43
44
45
46
47
48
49
50
51
52
53
54
55
56
57
58
59
60
61
62
63
64
65
66
67
68
69
70
71
72
73
74
75
76
(pprof) help
Commands:
callgrind Outputs a graph in callgrind format
comments Output all profile comments
disasm Output assembly listings annotated with samples
dot Outputs a graph in DOT format
eog Visualize graph through eog
evince Visualize graph through evince
gif Outputs a graph image in GIF format
gv Visualize graph through gv
kcachegrind Visualize report in KCachegrind
list Output annotated source for functions matching regexp
pdf Outputs a graph in PDF format
peek Output callers/callees of functions matching regexp
png Outputs a graph image in PNG format
proto Outputs the profile in compressed protobuf format
ps Outputs a graph in PS format
raw Outputs a text representation of the raw profile
svg Outputs a graph in SVG format
tags Outputs all tags in the profile
text Outputs top entries in text form
top Outputs top entries in text form
topproto Outputs top entries in compressed protobuf format
traces Outputs all profile samples in text form
tree Outputs a text rendering of call graph
web Visualize graph through web browser
weblist Display annotated source in a web browser
o/options List options and their current values
q/quit/exit/^D Exit pprof

Options:
call_tree Create a context-sensitive call tree
compact_labels Show minimal headers
divide_by Ratio to divide all samples before visualization
drop_negative Ignore negative differences
edgefraction Hide edges below <f>*total
focus Restricts to samples going through a node matching regexp
hide Skips nodes matching regexp
ignore Skips paths going through any nodes matching regexp
intel_syntax Show assembly in Intel syntax
mean Average sample value over first value (count)
nodecount Max number of nodes to show
nodefraction Hide nodes below <f>*total
noinlines Ignore inlines.
normalize Scales profile based on the base profile.
output Output filename for file-based outputs
prune_from Drops any functions below the matched frame.
relative_percentages Show percentages relative to focused subgraph
sample_index Sample value to report (0-based index or name)
show Only show nodes matching regexp
show_from Drops functions above the highest matched frame.
showcolumns Show column numbers at the source code line level.
source_path Search path for source files
tagfocus Restricts to samples with tags in range or matched by regexp
taghide Skip tags matching this regexp
tagignore Discard samples with tags in range or matched by regexp
tagleaf Adds pseudo stack frames for labels key/value pairs at the callstack leaf.
tagroot Adds pseudo stack frames for labels key/value pairs at the callstack root.
tagshow Only consider tags matching this regexp
trim Honor nodefraction/edgefraction/nodecount defaults
trim_path Path to trim from source paths before search
unit Measurement units to display

Option groups (only set one per group):
granularity
functions Aggregate at the function level.
filefunctions Aggregate at the function level.
files Aggregate at the file level.
lines Aggregate at the source code line level.
addresses Aggregate at the address level.
sort
cum Sort entries based on cumulative weight
flat Sort entries based on own weight
: Clear focus/ignore/hide/tagfocus/tagignore

type "help <cmd|option>" for more information

可以看到有巨多数据可以查看,上面我放了复制的文本而不是图片,方便以后复制。

这里以两个经典维度为例,即top和web。

top命令类似于linux perf的profile,而web命令是输出图示。

top
1
2
3
4
5
6
7
8
9
10
11
12
13
14
15
(pprof) top
Showing nodes accounting for 21260ms, 99.07% of 21460ms total
Dropped 62 nodes (cum <= 107.30ms)
Showing top 10 nodes out of 45
flat flat% sum% cum cum%
19110ms 89.05% 89.05% 19590ms 91.29% main.busyWork (inline)
750ms 3.49% 92.54% 750ms 3.49% runtime.memclrNoHeapPointers
480ms 2.24% 94.78% 480ms 2.24% runtime.asyncPreempt
450ms 2.10% 96.88% 450ms 2.10% runtime.futex
240ms 1.12% 98.00% 240ms 1.12% runtime.madvise
230ms 1.07% 99.07% 230ms 1.07% runtime.write1
0 0% 99.07% 970ms 4.52% main.allocMem (inline)
0 0% 99.07% 20560ms 95.81% main.main.func1
0 0% 99.07% 240ms 1.12% runtime.(*pageAlloc).scavenge
0 0% 99.07% 240ms 1.12% runtime.(*pageAlloc).scavenge.func1

几个参数解释如下:

  • flat: 某个函数执行用时,这个函数体中调用的其它函数不会被计算在内。
  • flat%:flat除以总执行用时
  • sum%:其上所有行的flat%累加。这个计算方法有点像前缀和数组,或者SQL里经常出现的Window函数。
  • cum:某个函数执行用时,和flat的区别是,这个函数体中调用的其它函数的用时也会被计算在内。
  • cum%:cum除以总执行时间。
web

通过交互式命令行对远程主机进行分析,由于没有GUI,无法拉起浏览器,所以可以退出该(pprof),使用命令拉起一个web服务,就可以进行远程查看。

1
2
3
4
5
6
7
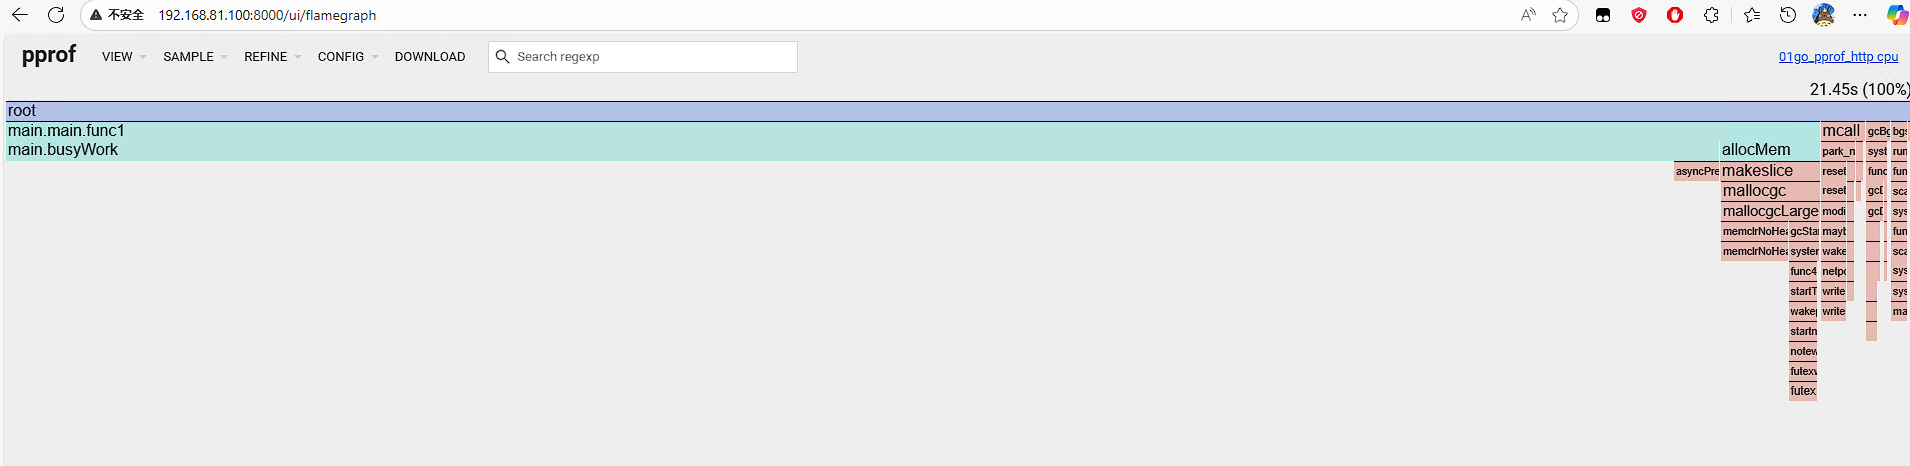
$ go tool pprof -http=0.0.0.0:8000 http://127.0.0.1:6060/debug/pprof/profile
Fetching profile over HTTP from http://127.0.0.1:6060/debug/pprof/profile
Saved profile in /home/hxy/pprof/pprof.01go_pprof_http.samples.cpu.003.pb.gz
Serving web UI on http://0.0.0.0:8000
Couldn't find a suitable web browser!

Set the BROWSER environment variable to your desired browser.

这样可以通过访问ip:8000来可视化访问pprof的profile性能信息,这里面包括调用栈可视化,也有火焰图。

image-20251009064928721

image-20251009064832273

这里主要说一下这个树状图的含义。

以最大的图示为例:

  • main:package名
  • busyWork:函数名(Symbol)
  • 19.11s(89.05%):flat(flat%)
  • of 19.59s(91.29%):cum(cum%)

hxy注:对于以上的性能采集的数据来说,实际上通过curl命令,把采集到的数据放在本地是更好的做法,因为pprof的工具支持分析采集到的本地二进制文件,且以这种方式采集到的数据可以进行保留,以复现实验数据,对于DIY玩家来说是一个更好的选择。

2.3 火焰图

2.3.1 speedscope

这个相当易用,只要打开speedscope把采集到的数据上传上去就可以了,并且分析数据一目了然,非常易用。

Speedscope官方推荐的命令为

1
curl http://localhost:$PORT/debug/pprof/profile?seconds=2 | speedscope -

实际上由于我们通常会进行其它的分析,保留分析文件这一步只是顺带就可以完成。

火焰图的展示效果如下,上方有类似于剪辑视频的轨道一样的方式来进行缩放,效果拔群。

image-20251009070718577

2.3.2 go-torch

go-torch is deprecated, use pprof instead

As of Go 1.11, flamegraph visualizations are available in go tool pprof directly!

该工具已经弃用,随pprof附赠的火焰图即为替代品,在上节已经展示。

总结

  • 通过发挥人类固有的给事物进行分类的技能,pprof的分析维度可以分为执行性能(CPU、trace),并发瓶颈(mutex、block),资源占用(heap、allocs、goroutine、threadcreate),而cmdline和symbol这两项是作为辅助其它功能的工具。后面可以从这几个大方面对程序的性能瓶颈进行分析。

  • trace涵盖内容稍多,后面专门再写一篇。

  • 对于火焰图来说,它的flat和cum其实非常直观,火焰图中某一个横向的长条即表示这个长条对应的symbol的cum,这一个长条对比下面长出来的一截,即为该symbol的flat。

  • 火焰图的优点在于,它除了展示热点函数之外,还直观展示了热点函数的调用栈,并且同时展示了调用栈的广度和深度。其实通过对文本类型的性能数据进行数据分析可以得到更加简明的结果,但从DIY脚本的角度来说,通过视觉快速定位显然更方便。

2025-10-06更新:pprof的block和mutex开启关闭没有发现区别是因为测试用例过于简单,经过刻意添加阻塞和互斥锁竞争行为,这两个功能确实需要指定开关。